Dynamic Incentive Management CRM
Banks ran sales incentives by hand, with structures that differed by branch, region, and product and changed constantly as new schemes and regulations came in. The manual math meant errors, late payouts, and constant disputes. I researched the problem and mapped the logic for a rule-driven CRM that calculates every incentive automatically and shows its work, the system behind a roughly 60% drop in disputes.
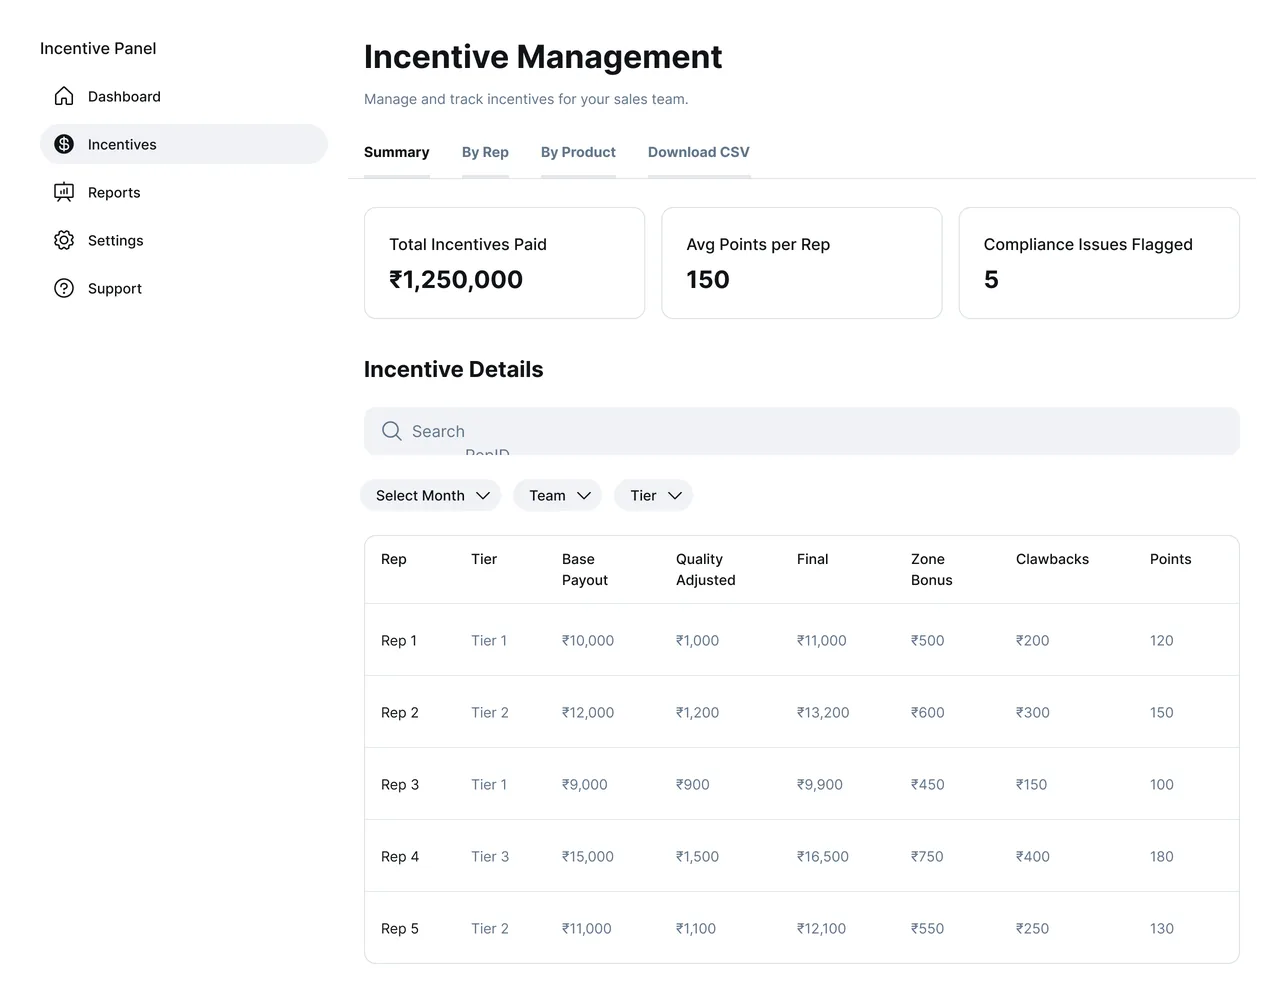
Understood why a manual, branch-by-branch incentive process produced errors, delays, and disputes.
Mapped every path a payout takes, from rules and roles through compliance checks, clawbacks, and final payout.
Researched and shaped two features the system leans on: clawback and recovery, and the audit trail.
Every branch had different incentive rules, and the math was done by hand.
Incentive structures at a bank vary by branch, region, and product, and they change constantly as new schemes launch, regulations shift, and seasonal offers come and go. Most CRMs lock their commission logic into fixed rules, so every one of those changes has to go through central IT to update. That backlog is why branches ended up calculating incentives by hand.
Manual math at that scale produces errors, late payouts, and, above all, disputes. A rep who can't see how a number was reached has no reason to trust it, and that mistrust chips away at the exact motivation the incentives are supposed to create.
Closed the deal, then had to take the payout on faith. No way to see which rule produced their number, so a low number read as a mistake, not a calculation.
Owned incentive structures they couldn't change without an IT ticket, and fielded the disputes that manual math produced in the meantime.
Needed every payout traceable back to a rule and a version, and had no reliable way to audit numbers that were calculated by hand, differently, in every branch.
One system where each branch can define its own rules, every payout is calculated automatically, and the math is clear enough that reps and managers stop arguing about it.
Not a friendlier calculator. Visibility.
I joined after the initial discovery work, so I wasn't in the room for the earliest interviews. But the ask that carried through nearly every conversation I had afterward, with reps closing deals and with the managers approving their payouts, was the same one: let us see how the system flows and how a payout actually happens. Not a faster number. A traceable one.
Reps and managers didn't want the math done differently. They wanted to watch it happen.
That reframed the brief. The job wasn't building a better calculator, it was building one that shows its work at every step, to the people whose trust depends on it.
I mapped every path a payout could take.
Before any interface existed, I mapped the logic end to end: how a payout moves from the rules and the person's role, through the calculation and a compliance check, to clawbacks and the final amount. That map is what "traceable" had to mean in practice, every step a rep or manager might ask about had to be a step the system could actually show.
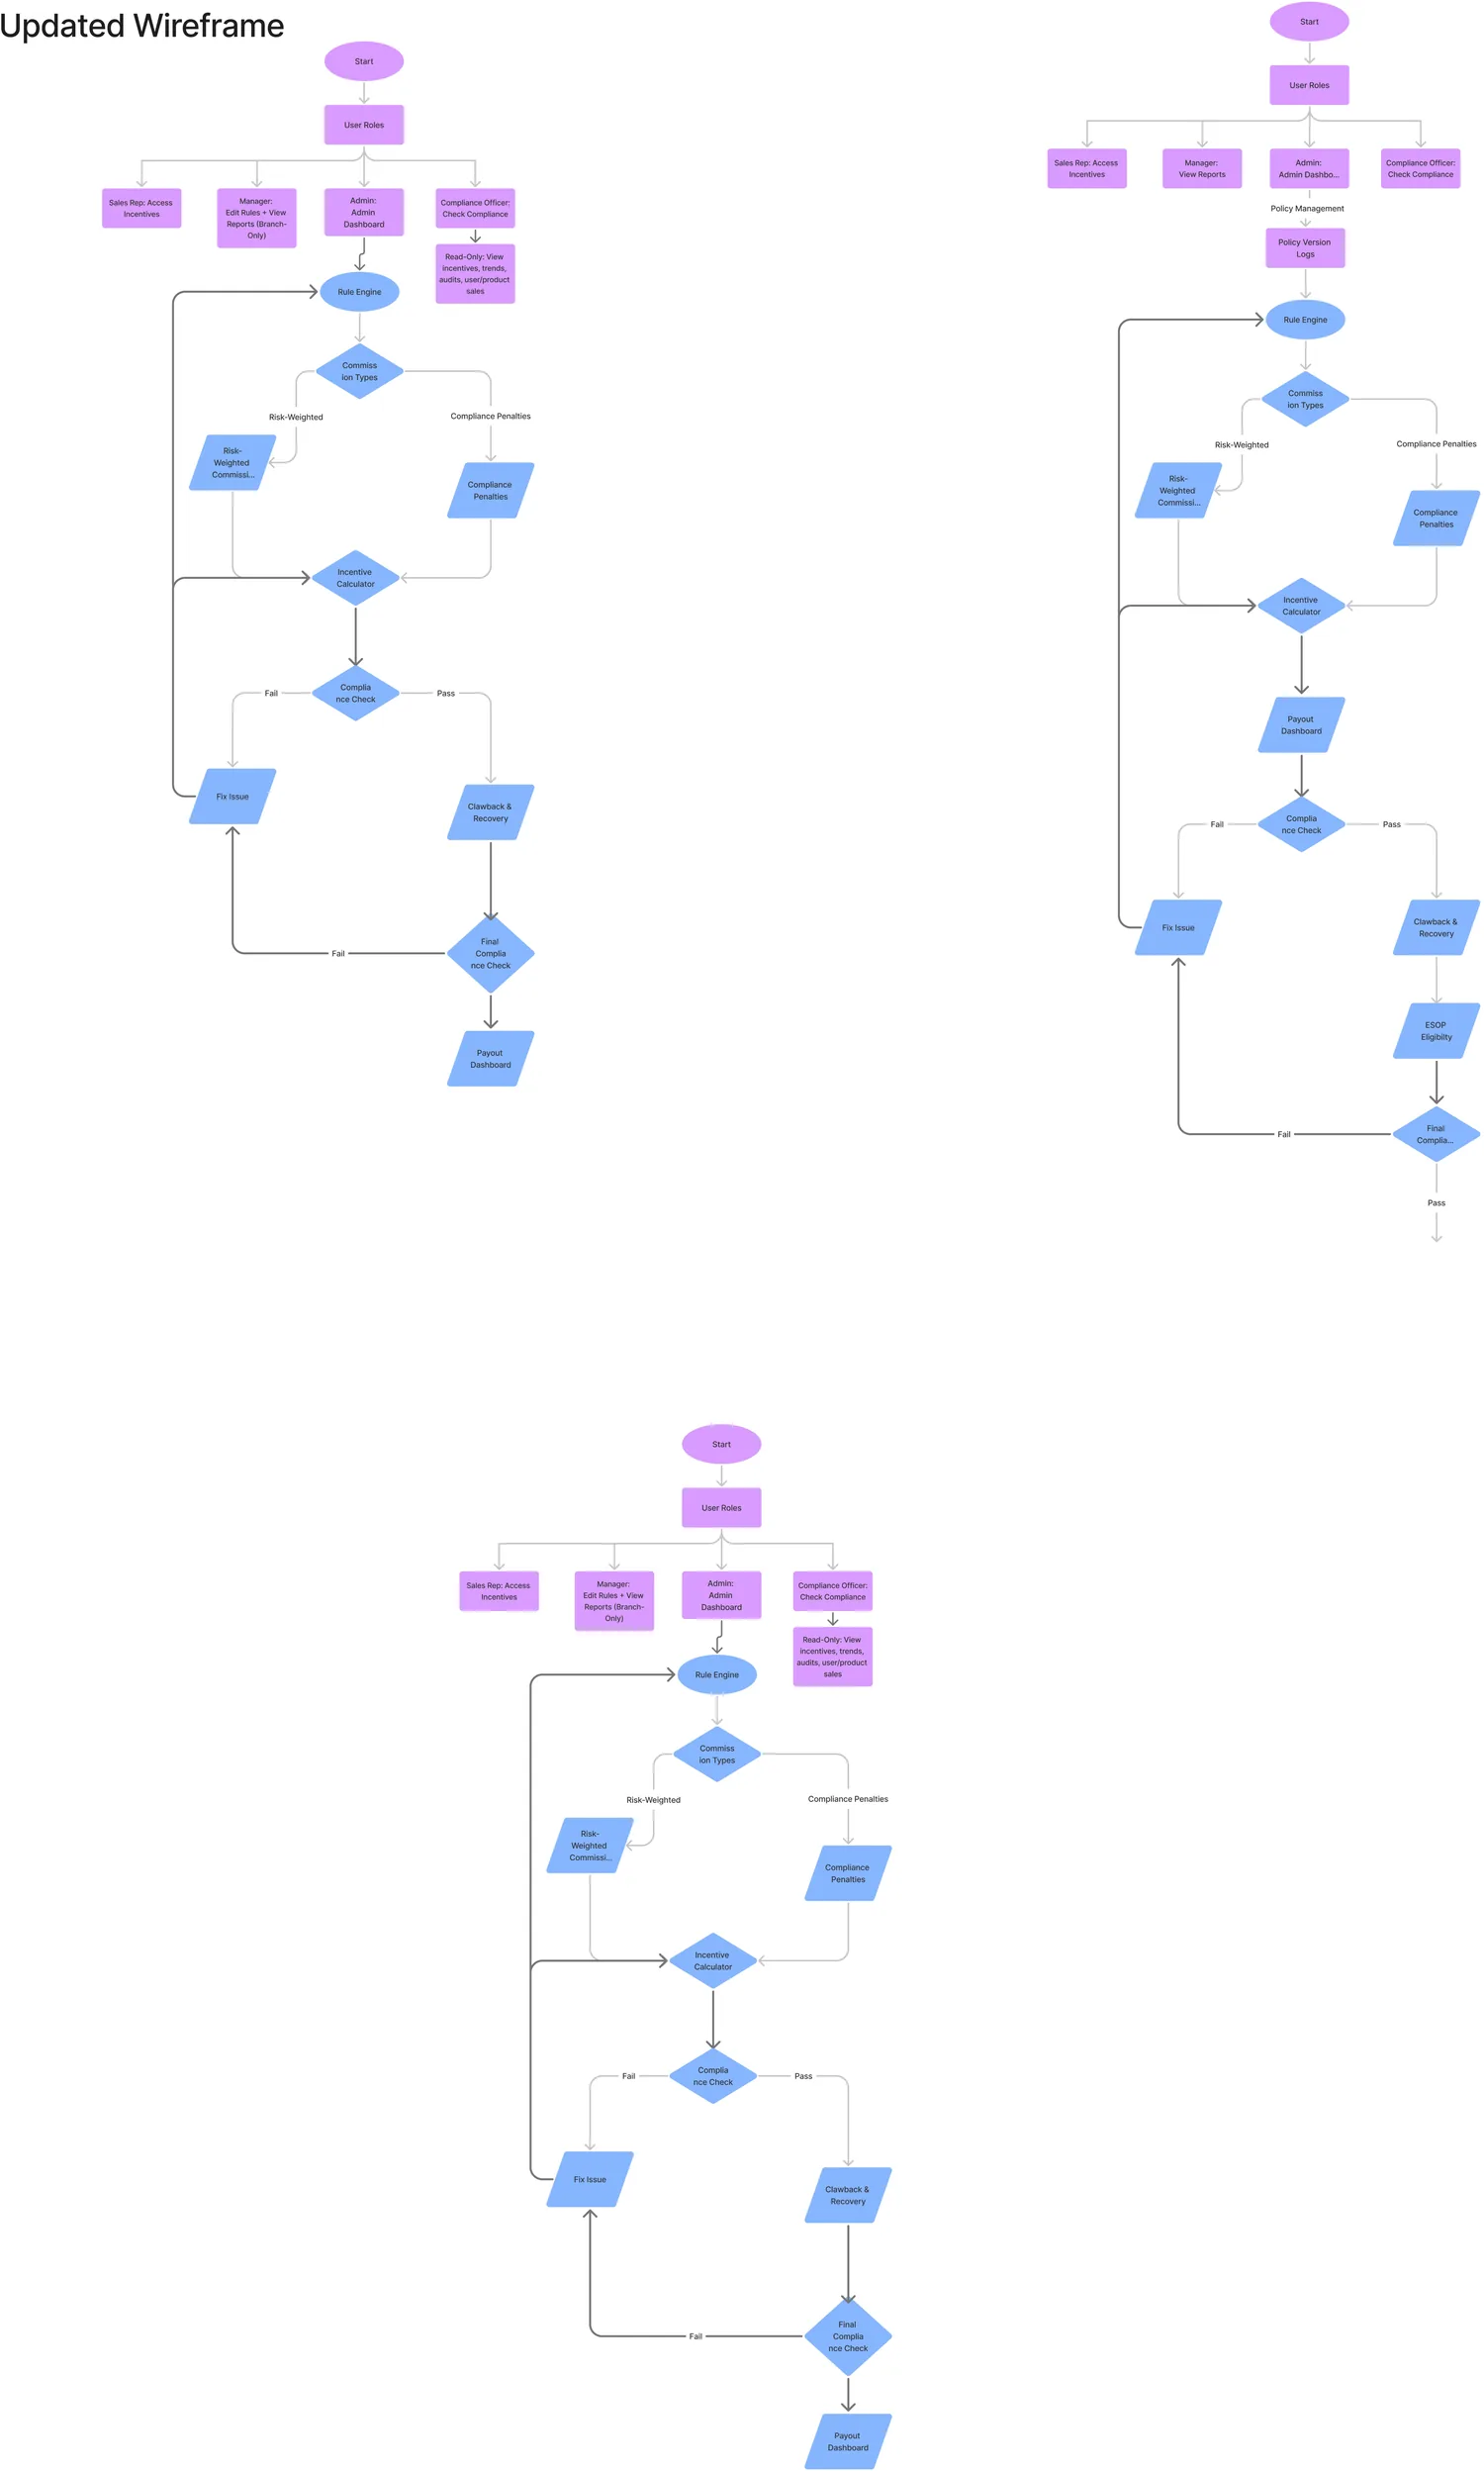
Iterating on the flow was the real work. Later passes added version logs so every rule change is traceable for compliance, added ESOP eligibility, and made failure explicit: if a payout fails a compliance check, it now routes back to be fixed instead of quietly breaking.
From a closed deal to a logged, auditable payout.
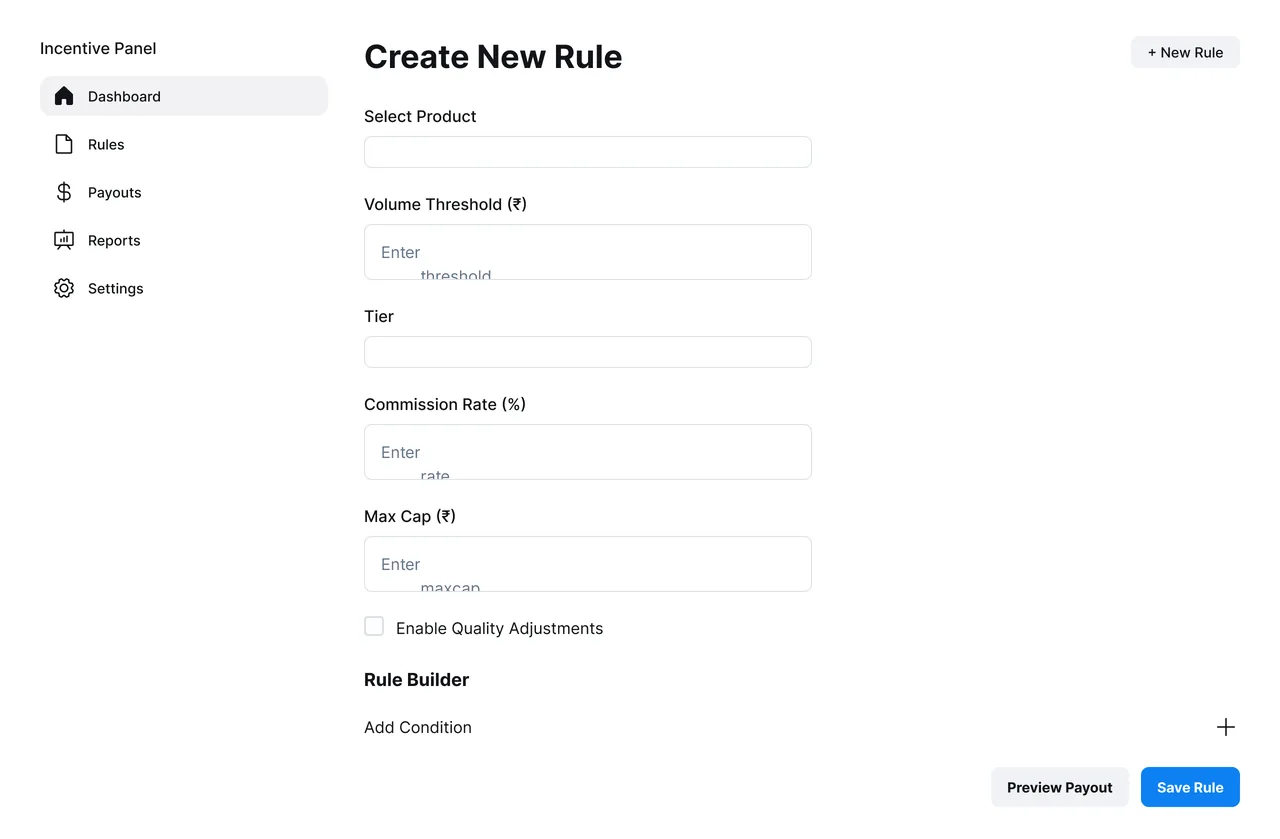
This is the walkthrough I'd give someone in a room: a branch admin sets the rules once, in plain fields, no code required. From there, every deal runs through the same four steps.
A rep closes a high-value loan. Nothing gets calculated until there's a real deal behind it.
It pulls every rule that applies to that product, region, and designation, including any active campaign or hierarchy override.
Computed instantly against those rules, and recalculated automatically if the deal's status changes or a rule gets updated retroactively.
The exact rule, version, and inputs behind that number get recorded per employee, ready for payout and for anyone who wants to check the math.
Because the rules are read fresh every time, a branch can adjust its own incentives the moment a scheme or regulation changes, instead of filing a ticket and waiting on IT. Four levers cover most of what a branch needs to define on its own:
Different incentive bands per product, with thresholds and a maximum cap.
The same sale rewards a Senior RM and a Branch Head differently.
Stack conditions, a time-bound campaign plus a product category, into one rule.
Branch → Region → Zone → National, with overrides allowed at each level.
Step 04 is where the transparency ask actually gets answered. The system keeps a complete incentive history for every employee and logs each rule change for compliance, so a manager can open the dashboard and show a rep exactly which rule produced their number. The dashboard was one of my two areas, so I prototyped it myself in Figma.
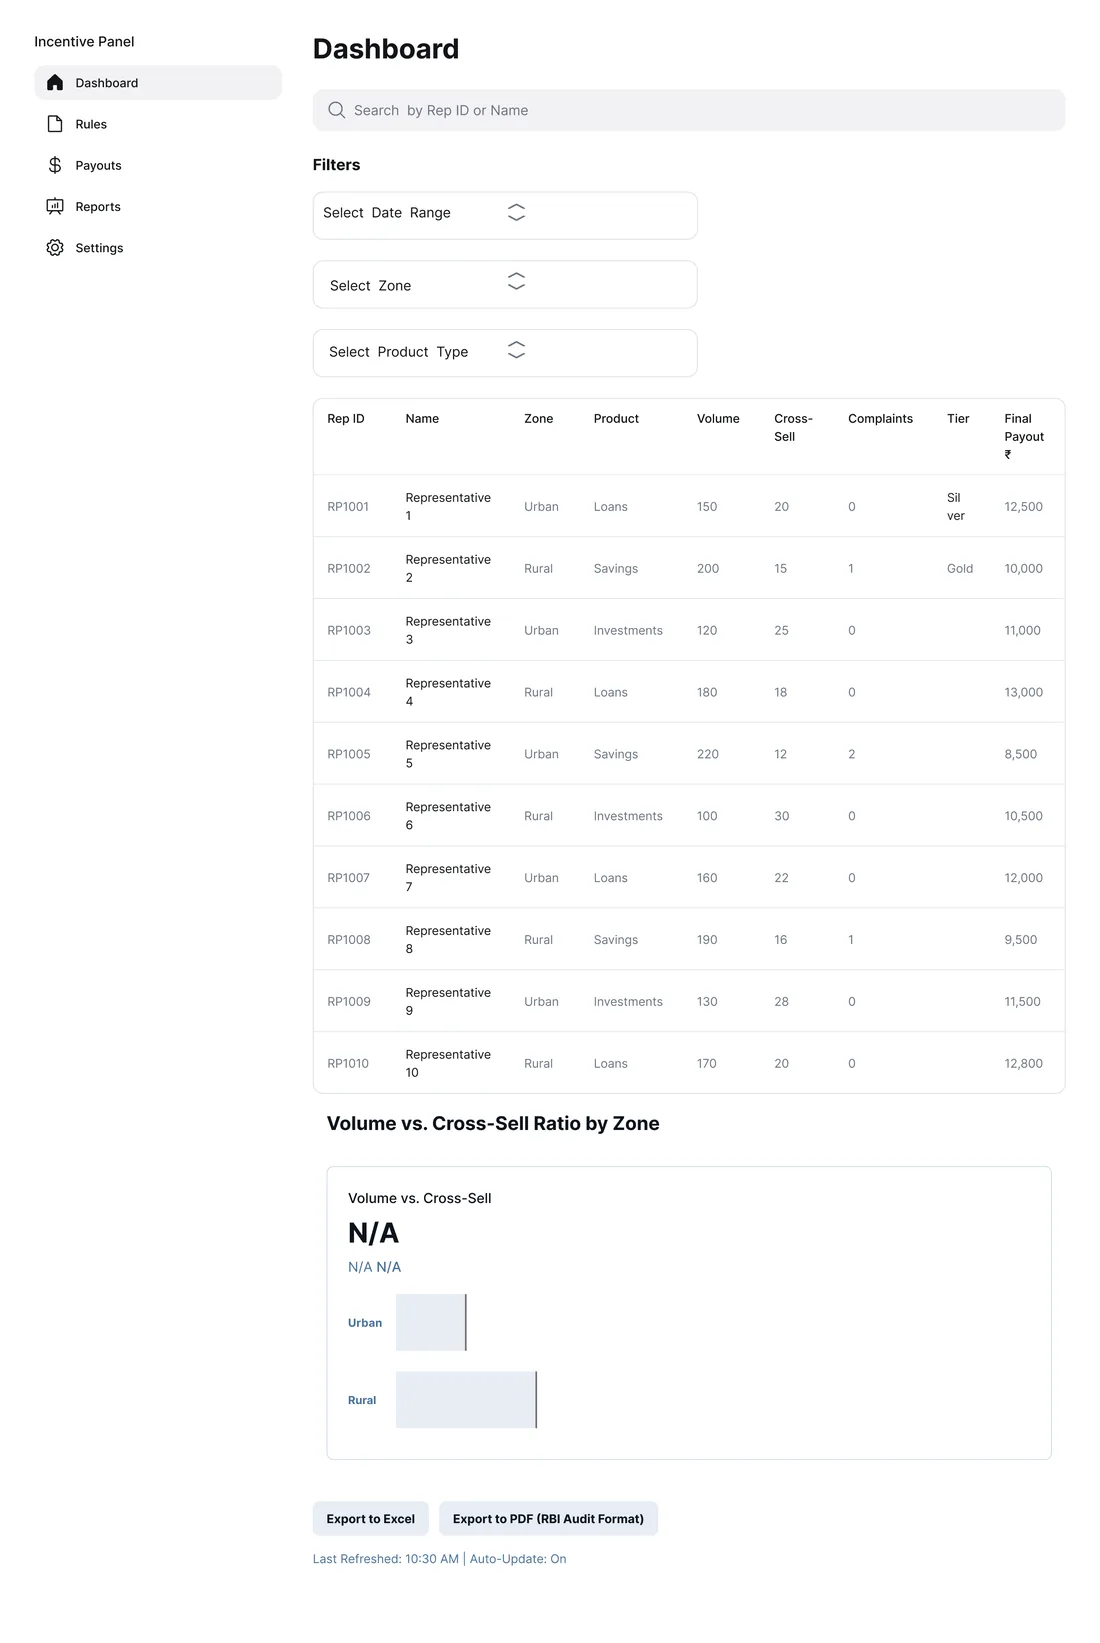
60% fewer disputes, 70% faster computation.
If this stayed live, the main thing I'd watch is time-to-resolution on a disputed payout, how long it takes a rep to see exactly which rule produced their number. Dispute volume tells you trust is low; resolution time tells you whether transparency is actually working.
Two features came out of my research.
My research mapped how banks actually structure sales incentives, benchmarked that against fintech models, and surfaced where the existing approach fell short. Two features came out of it, and both started as a gap in the research, not a line in the brief.
Clawback & recovery
Closing a sale isn't the same as making a good one. A loan that defaults or a policy that lapses shouldn't keep paying out. I defined the conditions for reversing or recovering a payout based on the quality of the sale, like whether a loan actually gets repaid, instead of just whether it closed. That became the Clawback & Recovery step in the flow.
The audit trail
A disputed number can only be settled if you can trace it. I made the case that every payout should map back to the exact rule, version, and inputs that produced it, so a rule change is logged rather than quietly overwritten. That traceability is why a disagreement becomes a lookup instead of a standoff.
Disputes were really about transparency.
People don't trust numbers they can't trace. Most of the value here came from making the calculation visible, not from changing the math, the same pain point every user segment named, whether they said it in those words or not.
Building the flow diagram surfaced every edge case early, failed compliance checks, clawbacks, retroactive rule changes, before a single screen existed.
A spreadsheet can hold the numbers. Getting people to trust them is the hard part, and that started with mapping the logic long before I designed a screen.